Earlier in this article series, we looked at the importance of the hypothesis in clinical trials and clinical research. Now we will look at the types of statistical errors that can arise when you test your hypothesis. As a reminder, a null hypothesis (H0), states that there is no relationship between the predictor and the outcome variables. If the p-value associated with the clinical trial data is less than the pre-determined statistical significance level, α, then one must reject the null hypothesis. α is the significance level and is usually set at 0.05. If your p-value is greater than α then one accepts the null hypothesis. In this article, we are going to discuss the types of errors in hypothesis testing.
Type I vs Type II Error
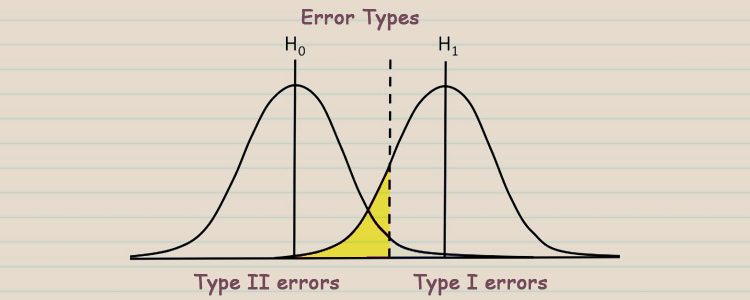
There are two types of errors. Let’s say that the null hypothesis was, “The study drug has no effect on cholesterol level” and α was 0.05. If the statistical analysis revealed a p-value of 0.01, you would reject the null hypothesis. This means that the drug in your clinical trial has an effect on cholesterol levels. There is a 5% chance (because the significance testing cut off is 0.05) that your choice to reject the null hypothesis is wrong. If you reject the null hypothesis but in reality, the effect of the drug on the cholesterol levels of the clinical trial participants is basically indistinguishable from random chance, then this is a type I error. A type I error occurs when you have a false positive. This means that you have incorrectly accepted the alternative hypothesis but the drug actually has no real impact on cholesterol levels.
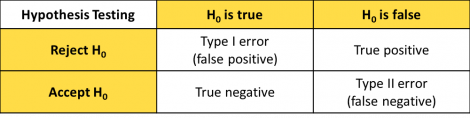
The second type of error can occur if one accepts the null hypothesis when in fact the alternative hypothesis (H1) is true. Using our previous example, if the p-value was 0.08, one would accept the null hypothesis. What if the drug actually has an effect on cholesterol levels? This would be a type II error, which is a false negative. You would have incorrectly concluded that the drug has no effect on cholesterol levels. The chance of incorrectly accepting the null hypothesis is represented by β. β is linked to both the effect size and the study power. If we increase α, β will increase and vice versa.
The Power of a Study
The power of a statistical analysis is (1-β). If β is set to 0.1, it means that there is a 10% chance that you will not detect a relationship between the study drug and the cholesterol levels, even though the drug has an effect on cholesterol. In other words, there is a 90% chance of identifying a true relationship between the predictor and outcome variables in your population.
Effect size and power are also closely related. If your effect size is large, for example, 75% of people whose parents had diabetes will develop diabetes themselves, then the true relationship between the variables will be easy to detect. This means that one can have a study with 90 or 95% power with a small sample size. If the effect size is small, for example, 2% of the people on medication for cholesterol will hallucinate, you will need a very large study population in order to see the relationship between intake of this medication and hallucination. Usually, the effect size is unknown when initiating a clinical trial. Power is affected by following factors:
- Sample size: Larger the sample size, higher the power
- Variance (σ2): Smaller the variance, higher the power
- Study design
One of the reasons we have these types of statistical errors is because no research study can examine the entire population. Therefore, research is conducted on a sample or subset of the entire population. This introduces sampling error. A sampling error occurs when the statistical values derived from individuals in the sample are generally different from the values of the entire population. This difference between the sample and the population values is called a sampling error.
So far in our series, we have discussed testing a hypothesis for a single population. If you are comparing the means of two different populations, it is assumed that the populations are both normal and that they have the same variance. In this case, the samples may be independent or paired.
Independent populations are similar in all their characteristics except the one character being studied. Paired samples usually involve data obtained by taking several measurements from the same people. These values are therefore not independent of each other.