


In this article series, we will be looking at some of the important concepts of biostatistics in clinical trials and clinical research. Statistics is frequently used to analyze quantitative research data. Clinical trials and clinical research both often rely on statistics. Clinical trials proceed through many phases. Contract Research Organizations (CRO) can be hired to conduct a clinical trial. Clinical trials are an important step in deciding if a treatment can be safely and effectively used in medical practice. Once the clinical trial phases are completed, biostatistics is used to analyze the results.
Research generally proceeds in an orderly fashion as shown below.
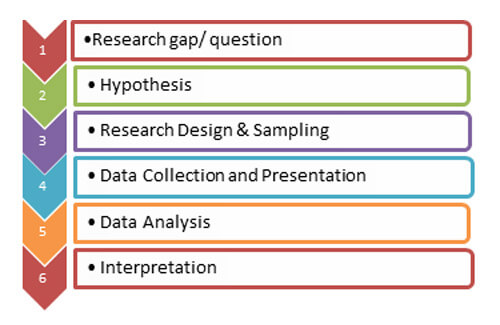
Once you have identified the research question you need to answer, it is time to frame a good hypothesis. The hypothesis is the starting point for biostatistics and is usually based on a theory. Experiments are then designed to test the hypothesis. What is a hypothesis? A research hypothesis is a statement describing a relationship between two or more variables that can be tested. A good hypothesis will be clear, avoid moral judgments, specific, objective, and relevant to the research question. Above all, a hypothesis must be testable.
A simple hypothesis would contain one predictor and one outcome variable. For instance, if your hypothesis was, “Chocolate consumption is linked to type II diabetes” the predictor would be whether or not a person eats chocolate and the outcome would be developing type II diabetes. A good hypothesis would also be specific. This means that it should be clear which subjects and research methodology will be used to test the hypothesis. An example of a specific hypothesis would be, “Adults who consume more than 20 grams of milk chocolate per day, as measured by a questionnaire over the course of 12 months, are more likely to develop type II diabetes than adults who consume less than 10 grams of milk chocolate per day.”
Null and Alternative Hypothesis
In statistics, the null hypothesis (H0) states that there is no relationship between the predictor and the outcome variable in the population being studied. For instance, “There is no relationship between a family history of depression and the probability that a person will attempt suicide.” The alternative hypothesis (H1) states that there is a relationship between the predictor (a history of depression) and the outcome (attempted suicide). It is impossible to prove a statement by making several observations but it is possible to disprove a statement with a single observation. If you always saw red tulips, it is not proof that no other colors exist. However, seeing a single tulip that was not red would immediately prove that the statement, “All tulips are red” is false. This is why statistics tests the null hypothesis. It is also why the alternative hypothesis cannot be tested directly.
The alternative hypothesis proposed in medical research may be one-tailed or two-tailed. A one-tailed alternative hypothesis would predict the direction of the effect. Clinical studies may have an alternative hypothesis that patients taking the study drug will have a lower cholesterol level than those taking a placebo. This is an example of a one-tailed hypothesis. A two-tailed alternative hypothesis would only state that there is an association without specifying a direction. An example would be, “Patients who take the study drug will have a significantly different cholesterol level than those patients taking a placebo”. The alternative hypothesis does not state if that level will be higher or lower in those taking the placebo.
The P-Value Approach to Test Hypothesis
Once the hypothesis has been designed, statistical tests help you to decide if you should accept or reject the null hypothesis. Statistical tests determine the p-value associated with the research data. The p-value is the probability that one could have obtained the result by chance; assuming the null hypothesis (H0) was true. You must reject the null hypothesis if the p-value of the data falls below the predetermined level of statistical significance. Usually, the level of statistical significance is set at 0.05. If the p- value is less than 0.05, then you would reject the null hypothesis stating that there is no relationship between the predictor and the outcome in the sample population.
However, if the p-value is greater than the predetermined level of significance, then there is no statistically significant association between the predictor and the outcome variable. This does not mean that there is no association between the predictor and the outcome in the population. It only means that the difference between the relationship observed and the relationship that could have occurred by random chance is small.
For example, null hypothesis (H0): The patients who take the study drug after a heart attack did not have a better chance of not having a second heart attack over the next 24 months.
Data suggests that those who did not take the study drug were twice as likely to have a second heart attack with a p-value of 0.08. This p-value would indicate that there was an 8% chance that you would see a similar result (people on the placebo being twice as likely to have a second heart attack) in the general population because of random chance.
The hypothesis is not a trivial part of the clinical research process. It is a key element in a good biostatistics plan regardless of the clinical trial phase. There are many other concepts that are important for analyzing data from clinical trials. In our next article in the series, we will examine hypothesis testing for one or many populations, as well as error types.


Thank you for this very informative article. You describe all the things very well. I am doing a fellowship in Clinical research training. This information really helps me a lot in my research studies. I have been connected with your site since a long time for such updates. Thank you once again