Manuscript writing is an integral part of sharing research outcomes. Authors write and publish manuscripts that target a specific journal audience. A manuscript presenting original research data contains different sections, namely introduction, methods, results, discussion, and conclusions. Usually, figures and tables present complex data visually in the results section of the manuscript. How do readers understand the information conveyed by your table or figure? The answer is easy. They look at the figures/tables and at the corresponding legends.
Legends or captions explain figures, tables, or images in the manuscript.
As you know, using of figures and tables in research papers serves the purpose of providing illustrative description of the subject matter. Similarly, what legends or captions do is provide descriptive information of the figures or tables.
Legends should satisfy these two primary requirements:
- Make readers understand the significance of the figure or table.
- Help interpret the meaning of the underlying results.
Students often face the following doubts when writing legends:
- What should legends comprise and how to structure them?
- Where do legends appear in a manuscript or a technical report?
Therefore, we provide a quick guideline on writing descriptive figure and table legends, also known as captions.
Figure and Table Legends
In a manuscript or a report, accompanying tables and figures display quantitative information. The aim is to present data visually to make readers understand technical information and the context in an easy way. Using various types of data representation formats is always recommended (tables, data plots, scatter plots, figures, etc.) when describing large quantities of data.
Make sure to consider the below points when writing legends in your manuscript or poster.
- Place captions above the table and align to the left (typically). Tables are read from the top down and should be numbered. For instance, Table 1.
- Do not forget to end the name of the figure with a period. Do not use a colon, semi colon, or a comma. For instance, Figure XYZ.
- Place captions below the figure. Figures can be presented as graphs, images or schematic diagrams and are usually read from bottom up.
- Use titles for both figures and graphs in oral presentation slides and posters.
- Captions require a figure/table number, title, and other explanatory information as appropriate.
- Ideally, do not exceed the word limit of 350 words for each figure legend.
- Cite the data sourced from other publications within captions as appropriate.
- Have a clear understanding of the concept associated with the experiment.
- Order the information logically.
- Provide measured units of the data, include concentrations, average measurements and significant values as appropriate.
Key Features of a Good Figure Legend
Title– Give a brief title that is relevant to the entire figure. It can be either descriptive (stating the process or type of analysis of the experiment) or declarative (stating the key findings or summarizing the results of the experiment).
Materials and Methods– This is the section to describe the techniques used in the experiment. It should be limited to the information that is absolutely necessary to understand the figure.
Results– The result statement must be used if the title is descriptive. Do not state the results if you have given a declarative title to the figure legend. This may vary not only among papers but also among different journals.
Definitions– This is an explanation of the features of a figure. This includes description of symbols, patterns, lines, colors, non-standard abbreviations, scale bars, and error bars that are a part of the figure. You can exclude elements that are already described in the actual figure.
Captions or Legends Should Narrate a Story
Captions in a manuscript (or report) narrate a story about the figures or tables to the reader. For effective caption writing use the following checklist:
- Captions should be brief, yet provide a comprehensive explanation of the data as it appears within the text.
- The past tense is frequently used to describe completed experiments, whereas the present tense can be used to convey a factual statement based on the results of your experiment.
- Captions should be self-explaining and should provide sufficient information to the readers without referring to the related text in the manuscript.
- It should include information on important aspects such as description (the type of experiment), method or technique used (sample size, type of animal model used, conditions examined, etc.), and the result obtained (p-value).
- Captions should be written in a complete sentence, starting with conventional capitalization.
- It should be a guide helping the reader to understand and locate the data they are looking for in the manuscript.
- It should clearly explain the context of the data.
- If appropriate, the caption should contain the units of measurement representative of the data type, duration of the experiment, etc.
- The caption should be a font size smaller than the text within the document.
- The caption should be left aligned with the table or graph.
However, make sure to check author guidelines of your target journal for the last two points!
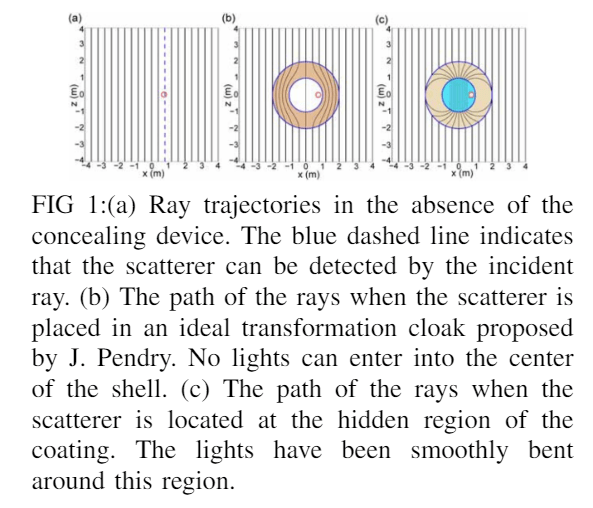
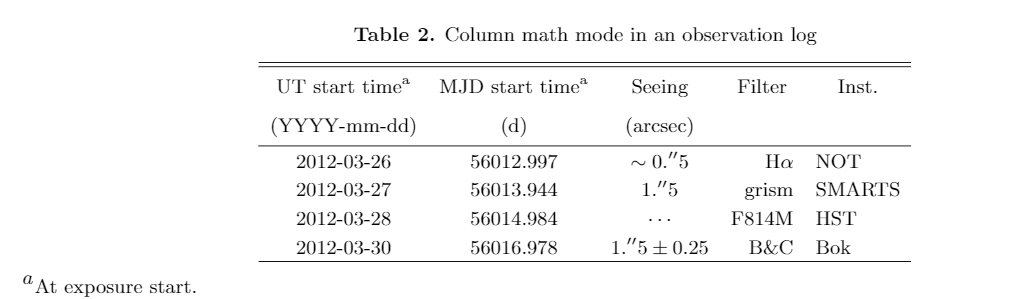
Let us have a look at examples of well-written legends for tables and figures.
(Source: https://www.overleaf.com/16744469whjwcjmcgxtw#/64164224/)
(Source: https://www.overleaf.com/16744374kttvywpdqyby#/64163939/)
How do you write legends for figures or tables in your manuscript? What things do you keep in your mind for a clear and concise description? Share with us in the comments section below some of your points on manuscript formatting!