Tables and figures undoubtedly play a critical role in enhancing manuscript quality. Scientific tables and graphs represent a large amount of statistical data in a consolidated manner. Since figures and tables are easy to refer to, readers prefer scanning through the tables and figures to get a fair idea of the study before going through the entire text of the manuscript. Figures and tables offer a quick overview of the research findings to journal editors and reviewers at the initial review stage as well as to readers once the article is published. It is important to note that tables and figures add value to the manuscript only if they are succinct and yet sufficiently descriptive. This article guides the authors on how to effectively use tables and figures in their manuscripts,
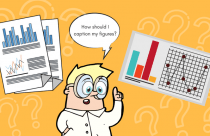
Presenting Data Visually
The visual presentation of data is a powerful tool. Tables and figures provide a concise, clear, easy-to-understand means of helping the reader to grasp important concepts presented in scientific research articles. When a significant amount of data needs to be presented, using text only can be cumbersome and confusing. Putting this data into a visual format allows the reader to quickly and easily absorb large amounts of information.
There is a risk, however, of over-usage. Effective usage of tables and figures in manuscript writing is selective usage. Tables and figures are meant to highlight the most critical aspects of the study being reported. Overwhelming the reader with visuals makes them less effective.
Tables
Put simply, tables are a means to present data to the reader. Generally, the structure of a table uses rows and columns to compare data using a set of variables. “Tables are used to complement the presentation in the text…when presenting all the desired information in the text would make the paper too dense with numbers.”1
It is important to keep in mind that tables should be understandable on their own. The reader should be able to analyze the data without having to read the surrounding text. To achieve this, data needs to be presented with clarity. A table should have an explicit title, headings, body, a key (when required), and footnotes or references (where necessary). Authors need to be clear about their intent before creating a table and ensure to present precise data.
The University of Reading Statistical Services Center defines two types of tables: Reference and Demonstration. Reference tables may appear as appendices and provide additional or larger amounts of information in support of the main text. Demonstration tables “are intended to be assimilated quickly by the reader or viewer.” They are usually included in the body of the manuscript.
Authors should ensure that the tables meet the following guidelines::
- There is a clear and descriptive title
- The headings are well-defined
- The data, overall, are placed in the columns from top to bottom in descending values
- Numbers and decimals are aligned
- Values are clearly defined (g/day, etc.)
Figures
Figures form a critical part of manuscripts, representing scientific data in a visual format. They enable readers to visualize information that is often hard to grasp from the text. The same rules that govern the creation of tables also govern the creation of figures. Authors should ensure the following conditions are met:
- Figures readily convey a large amount of information that is not easily conveyed by text alone
- Meaning is evident, independent of the surrounding text
- Titles and headings are clear and informative
- Values are clearly defined
- Keys and footnotes are used where necessary
- References are used when appropriate
Figures are often represented in the form of photos, sketches, drawings, graphs, diagrams, flow charts, and maps. Color and shape take on meaning and help relay the author’s intention and display a relationship among the data. As with tables, figures should be used sparingly for maximum impact.
Guidelines for effective data representation
Tables and figures must be presented strategically within a scientific research article. To that end, the following guidelines should be followed.
When to Use
- Tables or figures should be used when a large amount of data or information can be conveyed more efficiently through the use of visual representation rather than text.
- Just as important is knowing when NOT to use a table or figure, as too many visuals will interrupt the flow of the text and confuse the reader.
How to Present
- Tables and figures should be presented clearly, above all else.
- The authors need to decide what information requires emphasis and which format best suits the data.
- Journals often provide specific instructions to authors regarding the use and formatting of tables and figures
How to Integrate
- Tables and figures should enhance the manuscript text without interrupting the author’s message
- Manuscript text should build towards revealing critical information, expertly summarized by a table or figure
Formatting Guidelines
- Journal Guidelines
- Manuscript preparation should abide by the author instructions of the target journal.
- It is recommended that authors interact with journal editors for clarification and look through articles in a similar field of research published by that journal.
- Technology
- Standard tools that come with most word-processing programs are basic but useful
- Increasingly better and broader varieties of tools are available online and for purchase
- Regardless of format, good manuscript writing depends on clarity and accuracy—authors should always thoroughly edit and review their manuscript prior to submission with this in mind.
Figures and tables are powerful tools for scientific communication. They boost your manuscript by attracting the interest of readers by efficiently presenting complex information. Most journals editors and reviewers glance through figures and tables before they begin to review your manuscript.
Reference:
- James M. Clark (1996) Effective Tables and Figures. Retrieved from http://ion.uwinnipeg.ca/~clark/research/comm/C12_FIGU.pdf