


You know what is tragic? Having the potential to complete the research study but not doing the correct hypothesis testing. Quite often, researchers think the most challenging aspect of research is standardization of experiments, data analysis or writing the thesis! But in all honesty, creating an effective research hypothesis is the most crucial step in designing and executing a research study. An effective research hypothesis will provide researchers the correct basic structure for building the research question and objectives.
In this article, we will discuss how to formulate and identify an effective research hypothesis testing to benefit researchers in designing their research work.
What Is Research Hypothesis Testing?
Hypothesis testing is a systematic procedure derived from the research question and decides if the results of a research study support a certain theory which can be applicable to the population. Moreover, it is a statistical test used to determine whether the hypothesis assumed by the sample data stands true to the entire population.
The purpose of testing the hypothesis is to make an inference about the population of interest on the basis of random sample taken from that population. Furthermore, it is the assumption which is tested to determine the relationship between two data sets.
Types of Statistical Hypothesis Testing
Source: https://www.youtube.com/c/365DataScience
1. There are two types of hypothesis in statistics
a. Null Hypothesis
This is the assumption that the event will not occur or there is no relation between the compared variables. A null hypothesis has no relation with the study’s outcome unless it is rejected. Null hypothesis uses H0 as its symbol.
b. Alternate Hypothesis
The alternate hypothesis is the logical opposite of the null hypothesis. Furthermore, the acceptance of the alternative hypothesis follows the rejection of the null hypothesis. It uses H1 or Ha as its symbol
Hypothesis Testing Example:
A sanitizer manufacturer company claims that its product kills 98% of germs on average.
To put this company’s claim to test, create null and alternate hypothesis
H0 (Null Hypothesis): Average = 98%
H1/Ha (Alternate Hypothesis): The average is less than 98%
2. Depending on the population distribution, you can categorize the statistical hypothesis into two types.
a. Simple Hypothesis
A simple hypothesis specifies an exact value for the parameter.
b. Composite Hypothesis
A composite hypothesis specifies a range of values.
Hypothesis Testing Example:
A company claims to have achieved 1000 units as their average sales for this quarter. (Simple Hypothesis)
The company claims to achieve the sales in the range of 900 to 100o units. (Composite Hypothesis).
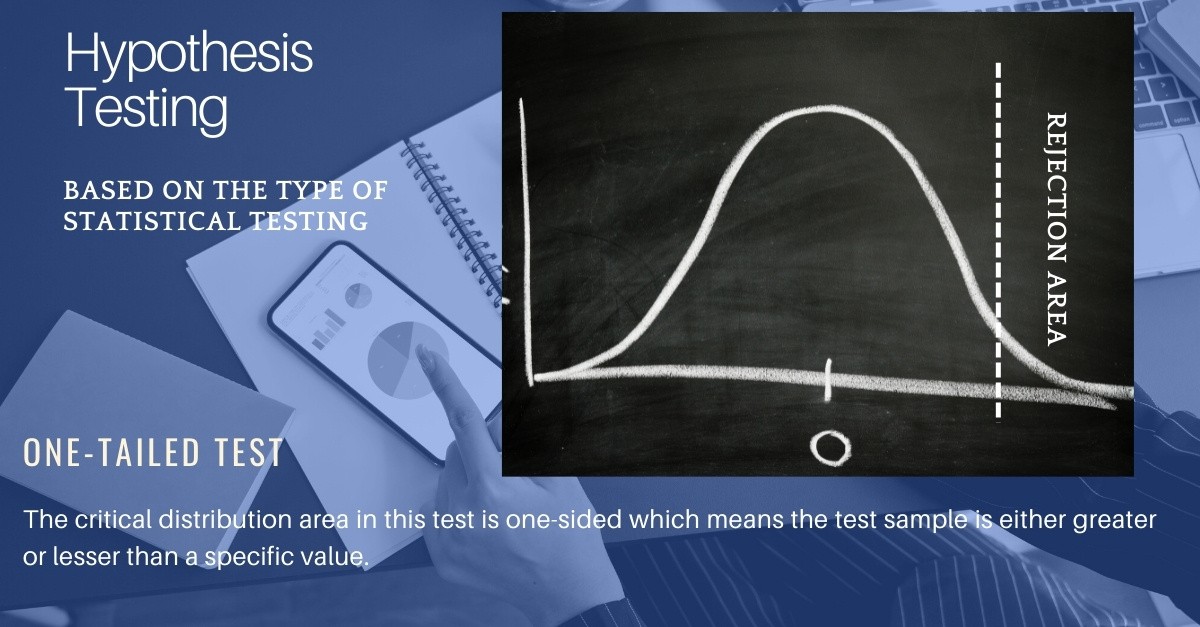
3. Based on the type of statistical testing, the hypothesis in statistics is of two types.
a. One-Tailed
One-Tailed test or directional test considers a critical region of data which would result in rejection of the null hypothesis if the test sample falls in that data region. Therefore, accepting the alternate hypothesis. Furthermore, the critical distribution area in this test is one-sided which means the test sample is either greater or lesser than a specific value.
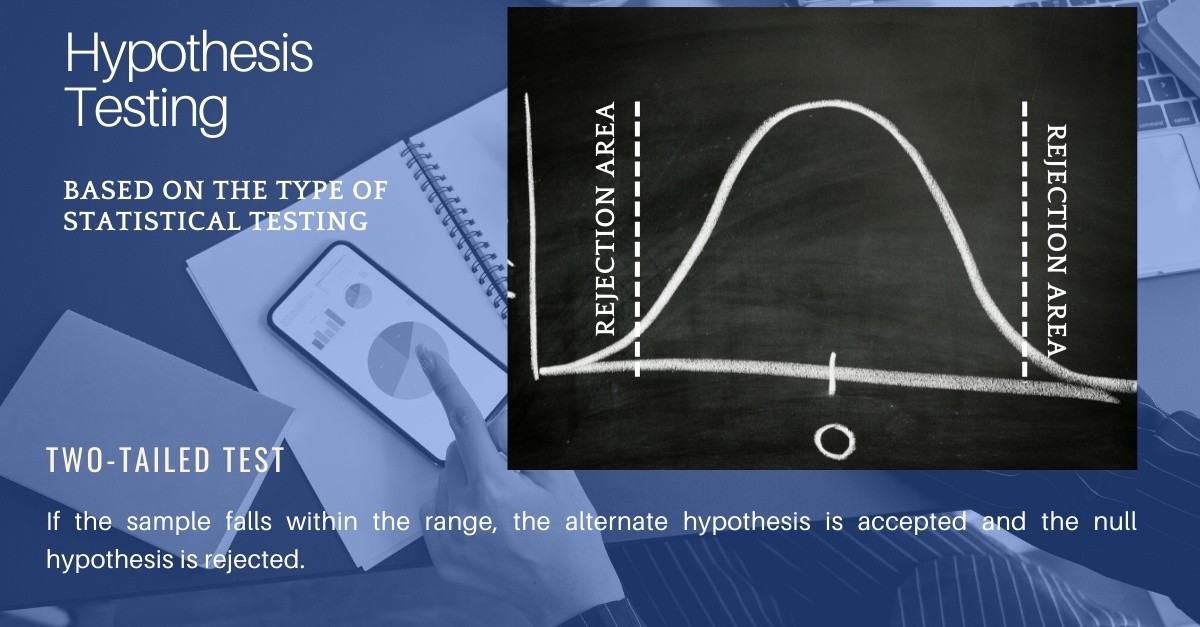
b. Two-Tailed
Two-Tailed test or nondirectional test is designed to show if the sample mean is significantly greater than and significantly less than the mean population. Here, the critical distribution area is two-sided. If the sample falls within the range, the alternate hypothesis is accepted and the null hypothesis is rejected.
Statistical Hypothesis Testing Example:
Suppose H0: mean = 100 and H1: mean is not equal to 100
According to the H1, the mean can be greater than or less than 100. (Two-Tailed test)
Similarly, if H0: mean >= 100, then H1: mean < 100
Here the mean is less than 100. (One-Tailed test)
Steps in Statistical Hypothesis Testing
Step 1: Develop initial research hypothesis
Research hypothesis is developed from research question. It is the prediction that you want to investigate. Moreover, an initial research hypothesis is important for restating the null and alternate hypothesis, to test the research question mathematically.
Step 2: State the null and alternate hypothesis based on your research hypothesis
Usually, the alternate hypothesis is your initial hypothesis that predicts relationship between variables. However, the null hypothesis is a prediction of no relationship between the variables you are interested in.
Step 3: Perform sampling and collection of data for statistical testing
It is important to perform sampling and collect data in way that assists the formulated research hypothesis. You will have to perform a statistical testing to validate your data and make statistical inferences about the population of your interest.
Step 4: Perform statistical testing based on the type of data you collected
There are various statistical tests available. Based on the comparison of within group variance and between group variance, you can carry out the statistical tests for the research study. If the between group variance is large enough and there is little or no overlap between groups, then the statistical test will show low p-value. (Difference between the groups is not a chance event).
Alternatively, if the within group variance is high compared to between group variance, then the statistical test shows a high p-value. (Difference between the groups is a chance event).
Step 5: Based on the statistical outcome, reject or fail to reject your null hypothesis
In most cases, you will use p-value generated from your statistical test to guide your decision. You will consider a predetermined level of significance of 0.05 for rejecting your null hypothesis, i.e. there is less than 5% chance of getting the results wherein the null hypothesis is true.
Step 6: Present your final results of hypothesis testing
You will present the results of your hypothesis in the results and discussion section of the research paper. In results section, you provide a brief summary of the data and a summary of the results of your statistical test. Meanwhile, in discussion, you can mention whether your results support your initial hypothesis.
Conclusion
Note that we never reject or fail to reject the alternate hypothesis. This is because the testing of hypothesis is not designed to prove or disprove anything. However, it is designed to test if a result is spuriously occurred, or by chance. Thus, statistical hypothesis testing becomes a crucial statistical tool to mathematically define the outcome of a research question.
Have you ever used hypothesis testing as a means of statistically analyzing your research data? How was your experience? Do write to us or comment below.


Well written and informative article.
good article
Nicely explained!
Its amazing & really helpful.