


Remember that impending feeling you get when you are asked to analyze your data! Now that you have all the required raw data, you need to statistically prove your hypothesis. Representing your numerical data as part of statistics in research will also help in breaking the stereotype of being a biology student who can’t do math.
Statistical methods are essential for scientific research. In fact, statistical methods dominate the scientific research as they include planning, designing, collecting data, analyzing, drawing meaningful interpretation and reporting of research findings. Furthermore, the results acquired from research project are meaningless raw data unless analyzed with statistical tools. Therefore, determining statistics in research is of utmost necessity to justify research findings. In this article, we will discuss how using statistical methods for biology could help draw meaningful conclusion to analyze biological studies.
Role of Statistics in Biological Research
Statistics is a branch of science that deals with collection, organization and analysis of data from the sample to the whole population. Moreover, it aids in designing a study more meticulously and also give a logical reasoning in concluding the hypothesis. Furthermore, biology study focuses on study of living organisms and their complex living pathways, which are very dynamic and cannot be explained with logical reasoning. However, statistics is more complex a field of study that defines and explains study patterns based on the sample sizes used. To be precise, statistics provides a trend in the conducted study.
Biological researchers often disregard the use of statistics in their research planning, and mainly use statistical tools at the end of their experiment. Therefore, giving rise to a complicated set of results which are not easily analyzed from statistical tools in research. Statistics in research can help a researcher approach the study in a stepwise manner, wherein the statistical analysis in research follows –
1. Establishing a Sample Size
Usually, a biological experiment starts with choosing samples and selecting the right number of repetitive experiments. Statistics in research deals with basics in statistics that provides statistical randomness and law of using large samples. Statistics teaches how choosing a sample size from a random large pool of sample helps extrapolate statistical findings and reduce experimental bias and errors.
2. Testing of Hypothesis
When conducting a statistical study with large sample pool, biological researchers must make sure that a conclusion is statistically significant. To achieve this, a researcher must create a hypothesis before examining the distribution of data. Furthermore, statistics in research helps interpret the data clustered near the mean of distributed data or spread across the distribution. These trends help analyze the sample and signify the hypothesis.
3. Data Interpretation Through Analysis
When dealing with large data, statistics in research assist in data analysis. This helps researchers to draw an effective conclusion from their experiment and observations. Concluding the study manually or from visual observation may give erroneous results; therefore, thorough statistical analysis will take into consideration all the other statistical measures and variance in the sample to provide a detailed interpretation of the data. Therefore, researchers produce a detailed and important data to support the conclusion.
Types of Statistical Research Methods That Aid in Data Analysis
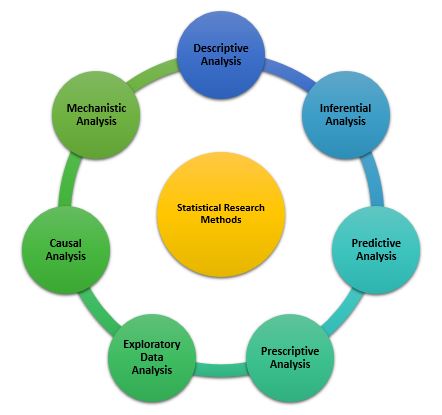
Statistical analysis is the process of analyzing samples of data into patterns or trends that help researchers anticipate situations and make appropriate research conclusions. Based on the type of data, statistical analyses are of the following type:
1. Descriptive Analysis
The descriptive statistical analysis allows organizing and summarizing the large data into graphs and tables. Descriptive analysis involves various processes such as tabulation, measure of central tendency, measure of dispersion or variance, skewness measurements etc.
2. Inferential Analysis
The inferential statistical analysis allows to extrapolate the data acquired from a small sample size to the complete population. This analysis helps draw conclusions and make decisions about the whole population on the basis of sample data. It is a highly recommended statistical method for research projects that work with smaller sample size and meaning to extrapolate conclusion for large population.
3. Predictive Analysis
Predictive analysis is used to make a prediction of future events. This analysis is approached by marketing companies, insurance organizations, online service providers, data-driven marketing, and financial corporations.
4. Prescriptive Analysis
Prescriptive analysis examines data to find out what can be done next. It is widely used in business analysis for finding out the best possible outcome for a situation. It is nearly related to descriptive and predictive analysis. However, prescriptive analysis deals with giving appropriate suggestions among the available preferences.
5. Exploratory Data Analysis
EDA is generally the first step of the data analysis process that is conducted before performing any other statistical analysis technique. It completely focuses on analyzing patterns in the data to recognize potential relationships. EDA is used to discover unknown associations within data, inspect missing data from collected data and obtain maximum insights.
6. Causal Analysis
Causal analysis assists in understanding and determining the reasons behind “why” things happen in a certain way, as they appear. This analysis helps identify root cause of failures or simply find the basic reason why something could happen. For example, causal analysis is used to understand what will happen to the provided variable if another variable changes.
7. Mechanistic Analysis
This is a least common type of statistical analysis. The mechanistic analysis is used in the process of big data analytics and biological science. It uses the concept of understanding individual changes in variables that cause changes in other variables correspondingly while excluding external influences.
Important Statistical Tools In Research
Researchers in the biological field find statistical analysis in research as the scariest aspect of completing research. However, statistical tools in research can help researchers understand what to do with data and how to interpret the results, making this process as easy as possible.
1. Statistical Package for Social Science (SPSS)
It is a widely used software package for human behavior research. SPSS can compile descriptive statistics, as well as graphical depictions of result. Moreover, it includes the option to create scripts that automate analysis or carry out more advanced statistical processing.
2. R Foundation for Statistical Computing
This software package is used among human behavior research and other fields. R is a powerful tool and has a steep learning curve. However, it requires a certain level of coding. Furthermore, it comes with an active community that is engaged in building and enhancing the software and the associated plugins.
3. MATLAB (The Mathworks)
It is an analytical platform and a programming language. Researchers and engineers use this software and create their own code and help answer their research question. While MatLab can be a difficult tool to use for novices, it offers flexibility in terms of what the researcher needs.
4. Microsoft Excel
Not the best solution for statistical analysis in research, but MS Excel offers wide variety of tools for data visualization and simple statistics. It is easy to generate summary and customizable graphs and figures. MS Excel is the most accessible option for those wanting to start with statistics.
5. Statistical Analysis Software (SAS)
It is a statistical platform used in business, healthcare, and human behavior research alike. It can carry out advanced analyzes and produce publication-worthy figures, tables and charts.
6. GraphPad Prism
It is a premium software that is primarily used among biology researchers. But, it offers a range of variety to be used in various other fields. Similar to SPSS, GraphPad gives scripting option to automate analyses to carry out complex statistical calculations.
7. Minitab
This software offers basic as well as advanced statistical tools for data analysis. However, similar to GraphPad and SPSS, minitab needs command over coding and can offer automated analyses.
Use of Statistical Tools In Research and Data Analysis
Statistical tools manage the large data. Many biological studies use large data to analyze the trends and patterns in studies. Therefore, using statistical tools becomes essential, as they manage the large data sets, making data processing more convenient.
Following these steps will help biological researchers to showcase the statistics in research in detail, and develop accurate hypothesis and use correct tools for it.
Conclusion
There are a range of statistical tools in research which can help researchers manage their research data and improve the outcome of their research by better interpretation of data. You could use statistics in research by understanding the research question, knowledge of statistics and your personal experience in coding.
Have you faced challenges while using statistics in research? How did you manage it? Did you use any of the statistical tools to help you with your research data? Do write to us or comment below!

Frequently Asked Questions
What are the uses of statistics in research?▼
Statistics in research can help a researcher approach the study in a stepwise manner:
1. Establishing a sample size 2. Testing of hypothesis
3. Data interpretation through analysis
Why is statistics important in research?▼
Statistical methods are essential for scientific research. In fact, statistical methods dominate the scientific research as they include planning, designing, collecting data, analyzing, drawing meaningful interpretation and reporting of research findings. Furthermore, the results acquired from research project are meaningless raw data unless analyzed with statistical tools. Therefore, determining statistics in research is of utmost necessity to justify research findings.
What are statistical tools in research?▼
Statistical tools in research can help researchers understand what to do with data and how to interpret the results, making this process as easy as possible. They can manage large data sets, making data processing more convenient. A great number of tools are available to carry out statistical analysis of data like SPSS, SAS (Statistical Analysis Software), and Minitab.


nice article to read
Holistic but delineating. A very good read.
(5/5)
an informative article to read. thanks