As a researcher, writing reports and articles is a big part of your job. Academics and scientists everywhere spend the majority of their time either doing research or writing about it. However, there is one aspect of reports and articles that we don’t think about very often, and that is scientific illustrations. We write articles and reports to convey our ideas to a variety of audiences—academics, fellow scientists, and the public. Everyone who has read a report or article recognizes that illustrations, figures, graphs, and infographics are an invaluable factor in clearly presenting ideas. Until recently, there haven’t been many good tools that make it easy to create clear and interesting scientific illustrations. But with the rise of digital technology, this is changing. In this article, we will look at ways you can create detailed and helpful illustrations to better present your ideas and research. We will also examine the latest tools for scientists and researchers to make such illustrations.
Scientific Illustrations: Where to Begin?
The first place to begin with a scientific illustration is research about the subject. Before you can draw something, you need to have a thorough understanding of it. If you are illustrating a process or an organ, it can help to break it down into smaller parts first so you can think about the best way to present it. Once you have all the information you need, make some preliminary sketches on paper. You can think of this step as similar to writing an outline for an article. You will need to have a good idea of what you want your illustration to look like before you start dealing with digital illustration tools.
When you’re making preliminary sketches, it’s important to keep your target audience grain mind first and foremost. Are you making this illustration for fellow academics or other scientists who already have a detailed understanding of the material? Or are you creating it for the general public? Determining your target audience will make it clear what information you need to include and what information you can leave out of your illustration.
Finally, before you turn to digital tools, remember that the purpose of a scientific illustration is not to introduce new materials. Scientific illustrations are used to present the information in your article in a way that is easier to understand for your audience. The illustration should clarify the topic of your research. For example, if you are writing about the way a stent opens up blocked arteries in a heart, then you can create an illustration showing the key components and highlighting the function of the stent.
Digital Tools for Scientific Illustrations
Once you have your preliminary ideas sketched out, it’s time to turn to digital tools. Most researchers are familiar with tools such as PowerPoint and Adobe Photoshop or Illustrator. While PowerPoint is good for making slideshows, it falls short when it comes to making actual illustrations. Adobe Photoshop and Illustrator are wonderful tools, but they are difficult to learn and can be expensive. Fortunately, some recent innovators have created illustration tools especially for scientists.
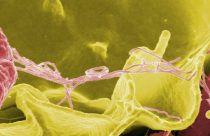
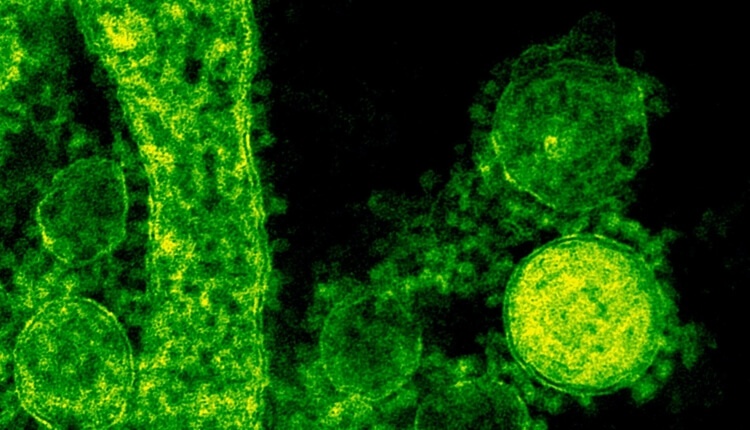
The hottest tool right now is BioRender, which was created by a group of women in Toronto who recognized the need for a simple illustration program for scientists. BioRender has a library of more than 30,000 life-science icons, which includes anatomical drawings and pictures of everything from SARS-CoV-2 virus particles to fruit flies. The program allows you to drag and drop icons easily and also has special drawing tools. The founders created the program after recognizing the need for it in fast-growing fields like immunology and microbiology that don’t have standard tools for illustrating, unlike engineering or chemistry. However, it does come with an institutional price tag of USD $35 a month or USD $99 for five users.
But BioRender isn’t the only company trying to meet the need for better tools to illustrate scientific concepts. EDrawSoft offers professional scientific diagrams and templates and is great for physics, mathematics, and chemistry. Gimp is another popular illustration software offering tools for high-quality image manipulation. Gimp’s popularity isn’t only because of its variety of tools and ability to work across platforms like Linux. It is also free. However, it’s often considered an alternative to Adobe Photoshop, meaning beginners might have a difficult time getting started. InkScape is another free tool popular for scientists who want to edit vector graphics. Cacoo is great for collaboration as it has the ability to create diagrams as well as edit and comment in real-time. These are just a few of the many tools available now to make high-quality images and scientific illustrations.
Tips for Making Eye-Catching Scientific Illustrations
Once you have identified the best tool for your purpose and learned the basics, it’s time to think about what makes a good scientific illustration. The short answer is: a good scientific illustration should present information clearly in an eye-catching way. It should enhance the understanding of the viewer, not make it more confusing. You can use color, but there’s no need to use the whole rainbow—color sparingly applied can highlight the most important aspects of your illustration. Scientific illustrations can also make use of text to help viewers understand what they are looking at. A great illustration can add a whole new dimension to the presentation of your research, leaving a strong impression on your audience.
As more journals accept illustrations along with articles, the demand for the skill of scientific illustration is also growing. The founders of BioRender highlight what a well-paying field scientific illustration is. Shiz Aoki is one of very few people in the world with an actual degree in medical illustration from Johns Hopkins University. The program only produces six graduates per year. Before Aoki started BioRender, she ran a medical illustration firm that charged between USD $1000 to USD $10,000 for commissions. For many scientists and researchers struggling to make ends meet due to the fallout from the coronavirus epidemic, freelancing in scientific illustration may offer a lucrative side hustle. With the number of tools available, investing some time in learning this new skill now can boost your career in more ways than one.
Do you create illustrations for your articles and presentations? What tools have you found helpful or difficult? Let us know your thoughts in the comments below.