


What is the thesis results section?
The thesis results section factually and concisely describes what was observed and measured during the study but does not interpret the findings. It presents the findings in a logical order.
After collecting and analyzing your research data, it’s time to write the results section. This article explains how to write and organize the thesis results section, the differences in reporting qualitative and quantitative data, the differences in the thesis results section across different fields, and the best practices for tables and figures.
The thesis results section factually and concisely describes what was observed and measured during the study but does not interpret the findings. It presents the findings in a logical order.
The opening paragraph of the thesis results section should briefly restate the thesis question. Then, present the results objectively as text, figures, or tables.
Quantitative research presents the results from experiments and statistical tests, usually in the form of tables and figures (graphs, diagrams, and images), with any pertinent findings emphasized in the text. The results are structured around the thesis question. Demographic data are usually presented first in this section.
For each statistical test used, the following information must be mentioned:
Qualitative research presents results around key themes or topics identified from your data analysis and explains how these themes evolved. The data are usually presented as text because it is hard to present the findings as figures.
For each theme presented, describe:
Relevant characteristics about your study subjects
Nevertheless, results should be presented logically across all disciplines and reflect the thesis question and any hypotheses that were tested.
The presentation of results varies considerably across disciplines. For example, a thesis documenting how a particular population interprets a specific event and a thesis investigating customer service may both have collected data using interviews and analyzed it using similar methods. Still, the presentation of the results will vastly differ because they are answering different thesis questions. A science thesis may have used experiments to generate data, and these would be presented differently again, probably involving statistics. Nevertheless, results should be presented logically across all disciplines and reflect the thesis question and any hypotheses that were tested.
In the Sciences domain (qualitative and experimental research), the results and discussion sections are considered separate entities, and the results from experiments and statistical tests are presented. In the HSS domain (qualitative research), the results and discussion sections may be combined.
There are two approaches to presenting results in the HSS field:
The use of figures and tables is highly encouraged because they provide a standalone overview of the research findings that are much easier to understand than wading through dry text mentioning one result after another. The text in the results section should not repeat the information presented in figures and tables. Instead, it should focus on the pertinent findings or elaborate on specific points.
Some popular software programs that can be used for the analysis and presentation of statistical data include Statistical Package for the Social Sciences (SPSS), R software, MATLAB, Microsoft Excel, Statistical Analysis Software (SAS), GraphPad Prism, and Minitab.
The easiest way to construct tables is to use the Table function in Microsoft Word. Microsoft Excel can also be used; however, Word is the easier option.
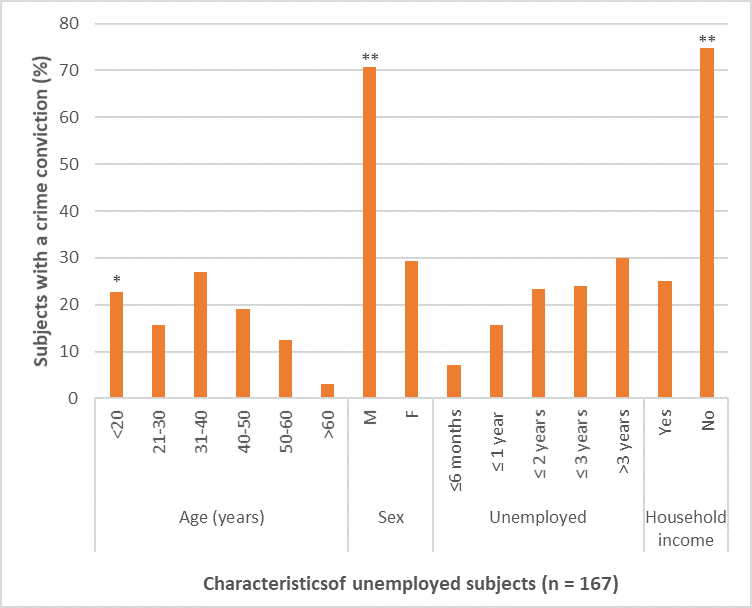
Quantitative results example: Figure 3 presents the characteristics of unemployed subjects and their rate of criminal convictions. A statistically significant association was observed between unemployed people <20 years old, the male sex, and no household income.
Qualitative results example: Table 5 shows the themes identified during the face-to-face interviews about the application that we developed to anonymously report corruption in the workplace. There was positive feedback on the app layout and ease of use. Concerns that emerged from the interviews included breaches of confidentiality and the inability to report incidents because of unstable cellphone network coverage.
Themes | Selected quotes |
| Ease of use of the app | The app was easy to use, and I did not have to contact the helpdesk |
| I wish all apps were so user-friendly! | |
| App layout | The screen was not cluttered. The text was easy to read |
| The icons on the screen were easy to understand | |
| Confidentiality | I am scared that the app developers will disclose my name to my employer |
| Unstable network coverage | I was unable to report an incident that occurred at one of our building sites because there was no cellphone reception |
| I wanted to report the incident immediately , but I had to wait until I was home, where the cellphone network signal was strong |
Table 5. Themes and selected quotes from the evaluation of our app designed to anonymously report workplace corruption.
Results are presented in three sections of your thesis: the results, discussion, and conclusion.
A thesis is the most crucial document that you will write during your academic studies. For professional thesis editing and thesis proofreading services, visit Enago Thesis Editing for more information.
Subscribe to our newsletter for regular insights from the research and publishing industry!
Have you completed all data collection procedures and analyzed all results?
Have you included all results relevant to your thesis question, even if they do not support your hypothesis?
Have you reported the results objectively, with no interpretation or speculation?
For quantitative research, have you included both descriptive and inferential statistical results and stated whether they support or contradict your hypothesis?
Have you used tables and figures to present all results?
In your thesis body, have you presented only the pertinent results and elaborated on specific aspects that were presented in the tables and figures?
Are all tables and figures correctly labeled and cited in numerical order in the text?
We accept all file formats, including Microsoft Word, Microsoft Excel, PDF, Latex, etc.
Please upload your research manuscript when you order Plagiarism Check Service. If you want to include the tables, charts, and figure legends in the plagiarism check, please ensure that all content is in editable formats and in one single document.
Acceptable repetition rate varies by journal but aim for low percentages (usually <5%). Avoid plagiarism (including self-plagiarism), cite sources, and use detection tools. Plagiarism can lead to rejection, reputation damage, and serious consequences. Consult your institution for guidance on addressing plagiarism concerns.
We can help you rewrite and paraphrase text in your manuscript to ensure it is not plagiarized under our Developmental Content Rewriting Service. You can provide specific passages or sentences that you are concerned about, and we can assist you in rephrasing them or citing the source materials in a proper format.
iThenticate searches for content matches in the following 30 languages: Chinese (Simplified and Traditional), Japanese, Thai, Korean, Catalan, Croatian, Czech, Danish, Dutch, Finnish, French, German, Hungarian, Italian, Norwegian (Bokmal, Nynorsk), Polish, Portuguese, Romanian, Serbian, Slovak, Slovenian, Spanish, Swedish, Arabic, Greek, Hebrew, Farsi, Russian, and Turkish. Please note that iThenticate will match your text with text of the same language.
Subscribe to our newsletter for regular insights from the research and publishing industry!